 Registered User
 New User
Power index turn weak after a week-long upward trend
22 Feb 2016
The index of power sector turned into red on February 22 after a week long journey into green zone.
The S&P BSE Power index was down 5.52 points (0.33%) to close at 1,664.99 on February 22 from the previous closing of 1,670.51. The highs and lows on February 22 were 1,680.07 and 1,658.63, respectively.
The performance of the global indices was strong on Monday. Global markets such as CAC, DAX and FTSE increased more or less 2% against their previous closes.
The Sensex increased 79.64 points (0.34%) to close at 23,788.79.
The performances of individual power stocks were largely positive. The highest growth was registered by Crompton Greaves which gained 6.22% to close at Rs 137.4. The maximum loss was registered by Thermax which lost 2.24% to close at Rs 755.55.
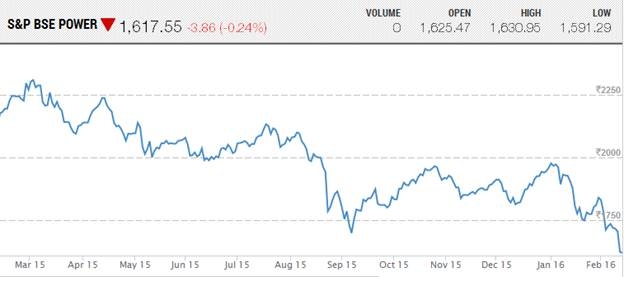
Movement of S&P BSE Power over the last one year:
Price Movement of stocks on S&P BSE Power
|
Company Name |
Last |
Change |
%Chg |
Mkt Cap |
|
Price |
(Rs cr) |
|||
|
ABB India |
1112 |
12.5 |
1.14 |
23564.21 |
|
Adani Power |
27.95 |
0.2 |
0.72 |
9318.36 |
|
Alstom T&D |
390.65 |
-1.55 |
-0.4 |
10002.46 |
|
BHEL |
101.2 |
-0.7 |
-0.69 |
24769.71 |
|
CESC |
445.7 |
12.65 |
2.92 |
5908.07 |
|
Crompton Greave |
137.4 |
8.05 |
6.22 |
8599.37 |
|
GMR Infra |
11.12 |
-0.06 |
-0.54 |
6711.97 |
|
Jaiprakash Pow |
4.8 |
-0.08 |
-1.64 |
1410.24 |
|
JSW Energy |
65.5 |
-0.75 |
-1.13 |
10742.36 |
|
NHPC |
20.35 |
0.3 |
1.5 |
22528.81 |
|
NTPC |
126.95 |
-2.55 |
-1.97 |
104676.17 |
|
Power Grid Corp |
139.4 |
-1.6 |
-1.13 |
72928.36 |
|
PTC India |
60.9 |
-0.55 |
-0.9 |
1802.69 |
|
Reliance Infra |
421.35 |
3.25 |
0.78 |
11081.08 |
|
Reliance Power |
44.7 |
-0.1 |
-0.22 |
12538.92 |
|
Siemens |
1037.9 |
-2.75 |
-0.26 |
36961.72 |
|
Suzlon Energy |
13.35 |
0.2 |
1.52 |
6702.37 |
|
Tata Power |
58.7 |
-0.1 |
-0.17 |
15876.17 |
|
Thermax |
755.55 |
-17.35 |
-2.24 |
9002.85 |
|
Torrent Power |
222 |
-2.3 |
-1.03 |
10669.69 |